Place & Health
INTRODUCTION
There are two ways to approach the current issue of health and place: as a citizen and as a built environment authority or practitioner. The current framing for citizens does not make it easy to understand the long-term contributions of the places people inhabit to their health. People have more resources and measures on factors related to individual decisions, such as diet and exercise, but do not have the same capacity in terms of factors such as environmental pollutants.
This report will focus primarily on the role of the built environment because practitioners have a significant influence on the ability of citizens to build healthy relationships between health and place. As a neuroscience lab our focus and perspective will be from a biological and health lense. Even when practitioners have the right intentions, the initiatives proposed, such as planting trees and creating low traffic neighbourhoods, are rarely determined by the actual environmental or psychosocial quality of the location and thus do not solve fundamental problems or give citizens agency.
Upgrading cities from merely places of commerce to habitats that can support human health will require a biological approach.
“…those living in poverty may already have a dysregulated HPA-Axis due to psychosocial stressors, which may leave them with compromised immune and metabolic systems. When these vulnerable systems are exposed to pollutants, this can create a further burden on their biological functions, thereby increasing their vulnerability to disease.”
ELEMENTS OF THE RELATIONSHIP BETWEEN HEALTH AND PLACE
Before introducing the specific tools, processes, and suggestions regarding the relationship between health and place, there are some key principles worth mentioning that should always be considered.
Exposure
Exposure is a key principle because accurately understanding the effect of exposure involves more nuance and investigation than simply presenting where environmental pollutants and other place based (produced by the lived experience of a place) stressors are present. People can live in the same general location but have different exposure due to different jobs, family dynamics, social discriminants, and socioeconomic differences that are reflected in their urban footprint.
For instance, a street can be heavily congested and polluted. On one side of the street, there are people with private greenery behind their houses who generally take a car when they are going out and can afford the right filtering systems in their house. On the other side of the street are flats with the only greenery being public and by the road. If they often walk and spend social time by the street to get to greenery then they experience more exposure to the pollutants than the first group. It is therefore important that representations of health and place factor in a representation of exposure when addressing individuals or are transparent in acknowledging that individual exposure was not taken into account.
Access
Access refers to both the physical and mental ability to engage, participate, and consume a product, service, or activity. The access principle goes against the idea that “if you build it, they will come” when it comes to built environment mitigations for health.
As an example, suppose you wanted to make sure that a neighbourhood has greenery, food venues, and health clinics. If these places are only located in dense and noisy locations, this might create a physical boundary for those on the neurodiverse spectrum or if the location is only accessible with a car it might reduce who can and cannot access the resources. These obstacles can in turn have health consequences.
Perception
Many analytical and scientific evaluations ignore the importance of lived experience to health solutions. This approach is counterintuitive if the goal is to have healthy citizens. Perception as a key principle can refer to the perception of access, safety, equity, or other personal or community benefits. If a small park is situated in an area that is not perceived as healthy or safe, people may have less motivation to use the park to stay healthy.
WHY IS NEUROSCIENCE USEFUL?
Neuroscience is a multidisciplinary branch of biology and is the scientific study of the brain and nervous system. The main neuroscientific approach which can begin to explain how urban environments interact with the human biological system is by looking at the stress response, which is one of the key pathways linking the internal human biological environment with the external environment. In this case, the interest is in how the biological system adapts to urban pollutants such as air, noise, thermal, and light. The use of neuroscience in refining the relationship of place and health comes in three parts.
The first is the generation of insights related to mental disorders such as depression, anxiety or PTSD and how they interact with metabolic disorders such as obesity and diabetes.
The second is knowledge of how urban environments create a health risk for the aforementioned disorders.
Finally, neuroscience can be used to identify areas that pose a health risk.
A major neuroscientific approach which can begin to explain how urban environments interact with the human biological system is by looking at the stress response, which is one of the key pathways linking the internal human biological environment with the external environment. In this case, the interest is in how the biological system adapts to urban pollutants such as air, noise, thermal and light.
Stress Response
The stress response is mitigated by the hypothalamic-pituitary-adrenal axis (HPA-Axis) which is a series of hormonal responses that help the body adapt to stressors. The system engages regardless of whether it is a psychological stressor such as losing a job, financial insecurity, witnessing a crime, or a physical stressor such as illness, environmental changes
or external pollutants. The HPA-Axis activation starts in the brain when the stressor — in this case a pollutant — triggers the hypothalamic production of corticotropin-releasing hormone (CRH). This trigger signals to the pituitary gland, which is also located in the brain, to synthesise the adrenal-corticotropin releasing hormone (ACTH). ACTH is then released into the circulation system where it reaches the adrenal glands, which are located above the kidneys. Once it reaches the adrenal glands ACTH stimulates the release of cortisol, which is another regulatory hormone. Finally, cortisol circulates back to the brain through the circulation system, creating a negative feedback loop that repeats until the body comes to homeostasis or equilibrium.
Chronic Stress
Despite the role the HPA-Axis plays in providing the biological system with the means to adapt to stressors by mobilising energy reserves and regulating necessary immune responses, the majority of stressors we experience in urban environments are chronic in nature and overly engage this system. A continual activation of the HPA-Axis can result in its dysregulation and a subsequent cascade of damage to human bodily systems through a process known as ‘allostatic load’ predisposing people to a range of health complications. The dysregulation of the HPA-Axis is a feature of many disease processes associated with chronic stress, such as diabetes, obesity, depression, PTSD, and anxiety.
Environmental Factors of Chronic Stress
The average citizen does not often have the ability to actively investigate the role their environment has in contributing to their health. This is especially true of factors they have no personal control over or are not directly related to their personal activities. Environmental risk factors are often a result of larger infrastructure and activity, such as construction, traffic activity, population density, and presence of green and blue space. A goal of urban health and environmental justice must be to make these factors easier for the average citizen to understand and navigate.
One example of where this information can be useful is visiting the doctor. If someone was able to accurately give insight into the types of environments they are exposed to, it would help a practitioner understand further factors potentially involved in the patient’s health outcomes.

INTRODUCING THE STRESS RISK SCORE
Given the aforementioned disparity for the average citizen, the Stress Risk Score (SRS) is a scale used to measure and present the environmental stress risk factors based on proxies for noise, air, light, and thermal pollution. These measures were established using a meta-analysis of how each stressor engages with the stress response system, specifically allostatic load. It was created to begin the culture of understanding concepts such as systemic and ecological health when understanding how your environment influences your lived experience (source). In other words, the SRS is not an acute diagnostic tool but a tool for understanding the general risk of an environment in a way that can lead to further action and investigation.
While each pollutant presents its own health risks — for example, light pollution has the potential to disrupt melatonin production, linking it to sleep disorders and depression — it is the composite exposure to these pollutants which needs to be addressed, especially as research is indicating that when found together they become more acute and present a higher risk to human biological systems. (source)
Why These Four Risk Factors?
The relationship between place and health is complicated, so it is important to be intentional and clear when it comes to creating a tool such as the SRS. While there is no official set of criteria to determine what makes a “good” factor to score, there are several considerations we took when deciding on the four pollutants represented in the SRS.
The first is understanding the previous research relating to health. Each of the four factors has research suggesting a contribution to chronic stress-related health outcomes. Following the literature review, the factor must have available annual data related to the specific metric presented in the research. For instance, the chronic stress research involving air pollution referred to particulate matter (PM 2.5). To represent the relationship between place and health involving air pollution and to draw conclusions we must use particulate matter data.
The selection of the four factors in the SRS does not belittle the importance of understanding other factors such as cold and hay fever nor the presence of certain diseases or disorders. The SRS intentionally focuses on less personalised environmental measures that are influenced by infrastructure and regional activity and should be treated as a pre-measure to understanding individual exposure and susceptibility
-
Air pollution presents a particularly insidious hazard given that the disease affects respiratory and cardio-vascular systems (source). These two systems are sensitive to air pollution as air pollution directly damages the mechanics and as a consequence the function of lungs, heart, and the circulatory system.
Pollutants directly damage our lungs and other organs, cause systemic inflammation (which can reduce the immune response), and initiate a stress response which, if chronic, can lead to subsequent damage to our bodies. Acute and chronic exposure to air pollution, therefore, weakens our whole system and depletes our body of resources that are essential to combat additional stressors, such as SARS-CoV-2, the virus that causes Covid-19.
The dangerous and important fact about fine particulate matter is that there is technically no safe amount that a person should be exposed to regularly (source).
HOW AIR POLLUTION IS AN URBAN PLANNING PROBLEM
There are four main types of air pollution sources:
mobile sources – such as cars, buses, planes, trucks, and trains
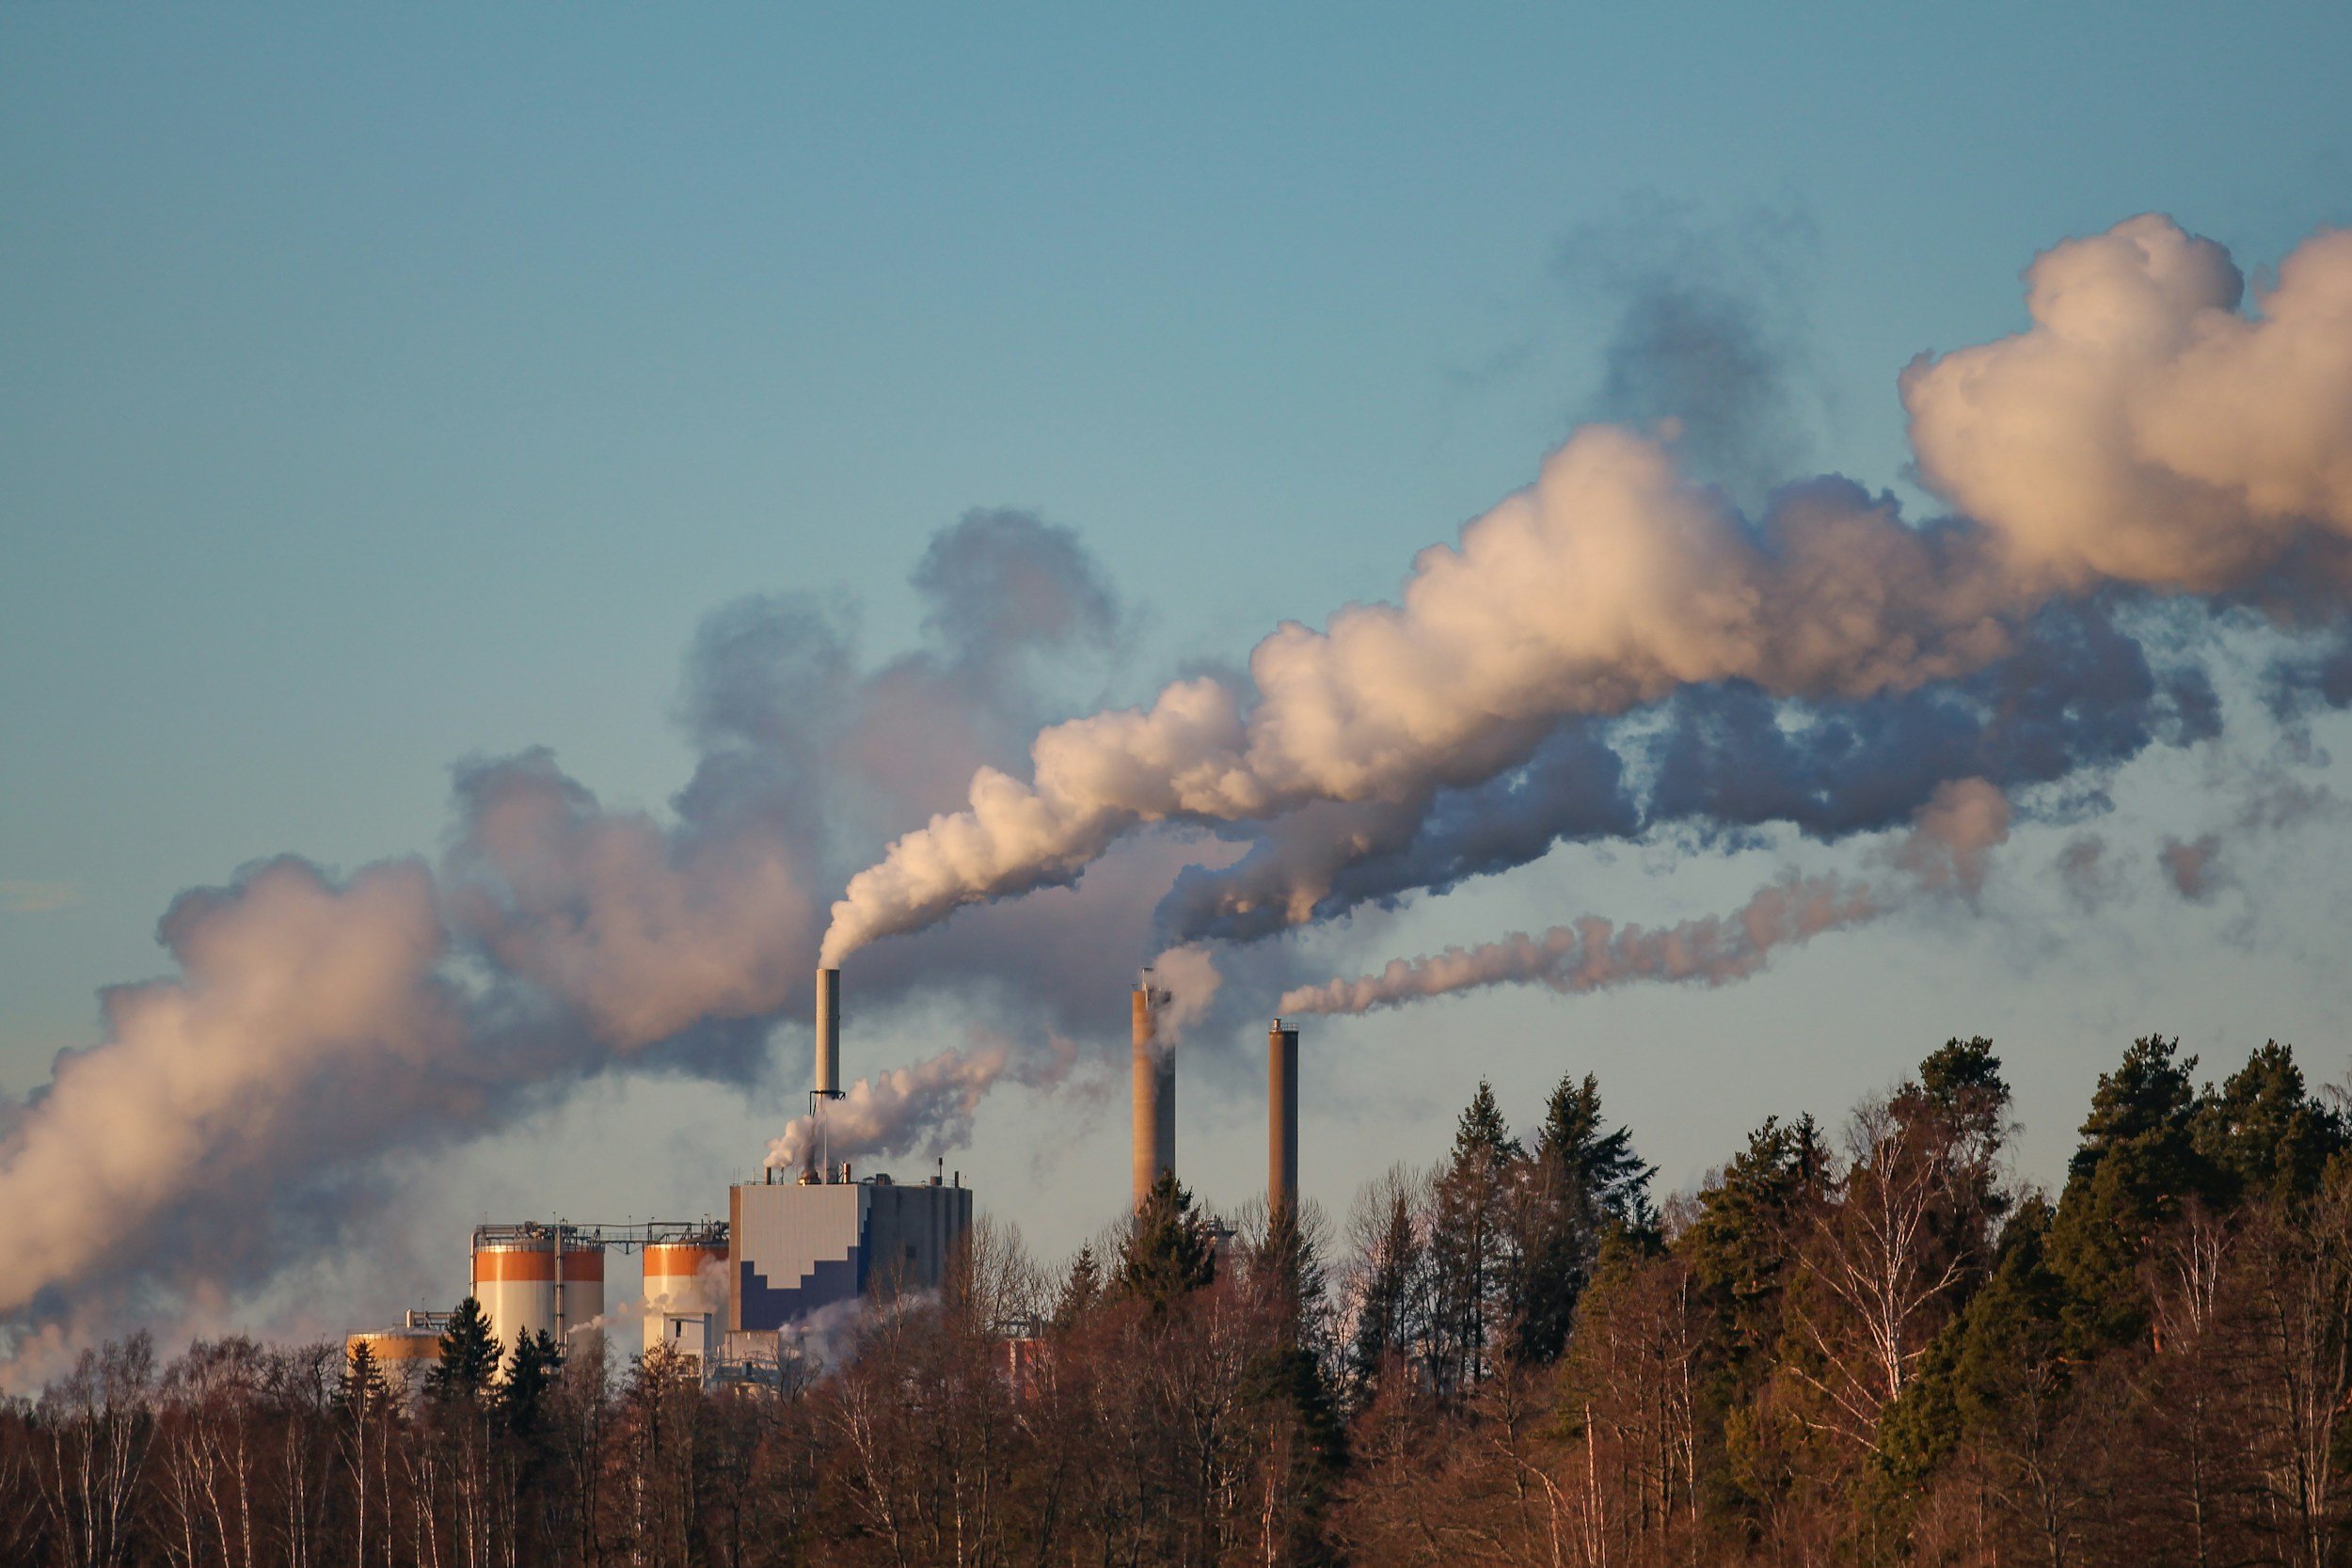
stationary sources – such as power plants, oil refineries, industrial facilities, and factories
area sources – such as agricultural areas, cities, and wood burning fireplaces
natural sources – such as wind-blown dust, wildfires, and volcanoes
The first three are factors within control of urban planning and local government regulation. The frequency, proximity and density of these factors are contributors to air pollution.
The majority of urban air pollution comes from vehicle movement but also includes particulates from asphalt, tyres and brake pads, and building exhausts.
-
Noise pollution is a pollutant that is manageable in moderation. People specifically experience the negative health outcomes of noise when it disrupts their sleep and ability to recover or focus. The research around noise pollution shows that noise can trigger both the endocrine and autonomic nervous system responses, with a sustained activation becoming a potential risk factor for cardiovascular disease and particularly coronary heart disease. The infrequent plane flying overhead will not be a likely contributor to this risk, but we find that high traffic and proximity to active train stations will.
The SRS uses the average annual decibels produced by road and rail as the metric of noise pollution. The range is based on a preliminary meta-analysis on the levels where research shows noticeable effects of exposure.
HOW NOISE POLLUTION IS AN URBAN PLANNING PROBLEM
Noise pollution, unwanted or excessive sound that can have deleterious effects on human health, wildlife, and environmental quality. Noise pollution is commonly generated inside many industrial facilities and some other workplaces, but it also comes from highway, railway, and airplane traffic and from outdoor construction activities.
-
Thermal pollution is going to be a factor of increased importance due to climate change as it encompasses everything from region down to the density of buildings and even further to the materiality of the environment. These range of factors are captured within the concept of the Urban Heat Island.
Heat stress is associated with elevated heart rates which can lead to heat stroke, cardiovascular issues, and a loss of sodium and potassium which is all of particular risk for those with weakened hearts, often the elderly. Urban heat islands generally have reduced air and water quality due to the industrialisation, transport, and density, so it is normal for heat pollution to rise with air pollution.
The SRS represents thermal pollution through the maximum values achieved in an extreme summer.
HOW THERMAL POLLUTION IS AN URBAN PLANNING PROBLEM
The main cause of the urban heat island effect is from the modification of land surfaces. Waste heat generated by energy usage is a secondary contributor. Urban Heat Island effect decreases air quality by increasing the production of pollutants such as ozone, and decreases water quality as warmer waters flow into area streams and put stress on their ecosystems.
Concrete and black asphalt in particular are two problematic materials as they retain heat. dark-coloured asphalt positively bakes when temperatures rise, absorbing 80% to 95% of the sun’s rays. On a sweltering summer day when the mercury reaches 100 degrees Fahrenheit, the surface temperature of L.A.’s roads can climb to as much as 50 degrees higher. The US city of Los Angeles has sought to paint roads white as a way to repel heat (3). Recommended further reading is ‘Dangerous Heat, Unequal Consequences’
-
Light pollution refers to artificially produced light, particularly in urban environments at night. This phenomenon is often referred to as light at night (LAN) or artificial light at night (ALAN) and is particularly important to people such as shift-workers.
The light disrupts the circadian rhythms of humans and wildlife alike as well as lowering melatonin production, which results in sleep deprivation, fatigue, headaches, stress, anxiety, and other health problems. Furthermore, LAN has been associated with increased breast cancer incidents in shift-working women.
The SRS represents light pollution in radiance based on satellite annual averages. As with air pollution, the scale starts at zero because the desired amount is virtually none at night. Of course, in practice there are street lights and signs that serve a purpose but this is where individual exposure becomes an important determinant of the actual effect of LAN, as the studies on this subject make clear.
HOW LIGHT POLLUTION IS AN URBAN PLANNING PROBLEM TO REGULATE
As defined by Darksky.org; Light pollution is a side effect of industrial civilisation. Its sources include building exterior and interior lighting, advertising, commercial properties, offices, factories, streetlights, and illuminated sporting venues.
-
All factors listed here are regulated by the planning sector. Therefore, if, as directed by government policy, urban planning policy is to improve health it should regulate the activities according to a health based measurement process. For example, if an area such as the Surrey Quays train station has an annual average SRS score of 3.5 (Air = 1, Heat = 0.7, Light = 1, Noise = 0.8) local planning should set development and management based objectives that seek to actively lower these values. These can be through regulation of activity or through materiality that absorbs particulate matter or dampen sound, most of which tend to be from the natural world.
The importance of directing health to be centred around a biological assessment of place is that it is universal. We all breathe the same air and hear the same sounds. Therefore, reducing exposure ensures that not only do all benefit but those who are more susceptible to stressors do not face further inequities. Equally, it is integral to focus on cleaning the environment from stressors before integrating more lifestyle health qualities such as encouraging active transport or outdoor seating areas. Exercise in polluted areas can cause unintended dysregulation of your stress system and elderly people dwelling in areas of high stress run health risks of complications at elevated heart rates.
Therefore, before introducing health and wellbeing initiatives to communities, authorities need better regulation of stressors in order to not exacerbate health inequities prevalent in society coming from historical classism and structural racism. It is wrong to place blame for poor health on individuals not exercising outdoors enough when their only choice is to be biologically impacted.

A completely artificial urban environment depleted of natural resources
PSYCHOSOCIAL FACTORS OF STRESS
Our body does not only suffer chronic stress due to pollutants. Psychosocial factors also play a part in our long-term health. The psychosocial relationship to health is a widely investigated field. We refer to two areas of investigation relevant to our work.
The Weathering Hypothesis
The weathering hypothesis was proposed to account for early health deterioration as a result of cumulative exposure to experiences of social, economic and political adversity. It is well documented that minority groups and marginalized communities suffer from poorer health outcomes. This may be due to a multitude of stressors including prejudice, social alienation, institutional bias, political oppression, economic exclusion and racial discrimination. The weathering hypothesis proposes that the cumulative burden of these stressors as individuals age is "weathering," and the increased weathering experienced by minority groups compared to others can account for differences in health outcomes.
Robert Sapolsky and the notion of free will
As a neuroendocrinologist, Sapolsky’s work has focused his research on issues of stress and neuronal degeneration. Sapolsky’s work looks into factors such as non-life-threatening stressors, such as constantly worrying about money or pleasing your boss, and how they trigger the release of adrenalin and other stress hormones, which, over time, can have devastating consequences to your health; "If you turn on the stress response chronically for purely psychological reasons, you increase your risk of adult onset diabetes and high blood pressure. If you're chronically shutting down the digestive system, there's a bunch of gastrointestinal disorders you're more at risk for as well."
THINKING ABOUT PSYCHOSOCIAL STRESS IN DATASETS
The Index of Multiple Deprivation (IMD) follows an established methodological framework in broadly defining deprivation to encompass a wide range of an individual’s living conditions and is collected every four years (source). The Ministry of Housing, Communities and Local Government makes it clear in the documentation for the IMD that the tool is not to specifically identify individuals as affluent or deprived. According to their documentation, people may be considered to be living in poverty if they lack the financial resources to meet their needs, whereas people can be regarded as deprived if they lack any kind of resources, not just income.
The IoD2019 (the most recent version of the IMD) is comprised of seven distinct domains of deprivation which, when combined and appropriately weighted, are; Income (22.5%), Employment (22.5%), Health Deprivation and Disability (13.5%), Education, Skills Training (13.5%), Crime (9.3%), Barriers to Housing and Services (9.3%), Living Environment (9.3%).
The IMD is an effective tool to use as a proxy for evaluating whether a person regularly engaging in these environments will be exposed to sustained psychosocial stressors.
COMBINING DATA TO THINK ABOUT BIOLOGICAL INEQUITY
Biological Inequity refers to the unequal distribution, exposure and vulnerability to health-threatening pollution levels within urban environments.
When people live in neighbourhoods that have high levels of pollutants, their systems become more exposed, which over time may cause them to develop long-term physical degradation to muscles and lung tissue as well as changes to insulin and metabolic functions.
Research indicates that those who live in impoverished urban environments are presented with higher levels of psychosocial stressors linked to poverty such as housing, economic and food insecurity, lack of high-quality healthcare, neglect, domestic abuse, etc. They are also at a higher risk of experiencing acute trauma, which is linked to PTSD. This suggests those living in poverty may already have a dysregulated HPA-Axis due to psychosocial stressors, which may leave them with compromised immune and metabolic systems. When these vulnerable systems are exposed to pollutants, this can create a further burden on their biological functions, thereby increasing their vulnerability to disease. In short, deprived environments can impose a double burden on a person’s biological system, resulting in a higher risk of disease. This insight is supported by population data which shows low SES demographics having a higher prevalence of metabolic and mental disorders.
Following the understanding of biological inequality and deprivation, the Urban Health Index (UHI) was created as a way to present the psychosocial and environmental stress risks in one score to reflect the urban health experience. When following the definition of deprivation proposed by the IMD, the SRS provides greater depth into the role the environment plays in the overall assessment. The UHI, therefore, shares the representation of each to create a score from 0.0-2.0 where 0 is worse and 2 is best.
USING THIS DATA TO CREATE HEALTH RISK HOT SPOTS

-
Stonebridge (Brent)
Golborne (Kensington and Chelsea)
St. Pancras and Somers Town (Camden)
Hackney Wick (Hackney)
Church Street (City of Westminster)
Notting Dale (Kensington and Chelsea)
Northumberland Park (Haringey)
Woodberry Down (Hackney)
Hackney Central (Hackney)
Homerton (Hackney)
Lansbury (Tower Hamlets)
North Walworth (Southwark)
Poplar (Tower Hamlets)
Hoxton West (Hackney)
Bromley North (Tower Hamlets)
Shepherd's Bush Green (Hammersmith and Fulham)
St. George's (Southwark)
Prince's (Lambeth)
College Park and Old Oak (Hammersmith and Fulham)
Finsbury Park (Islington)
-
Petts Wood and Knoll (Bromley)
Hayes and Coney Hall (Bromley)
West Wickham (Bromley)
Upminster (Havering)
Chelsfield and Pratts Bottom (Bromley)
Farnborough and Crofton (Bromley)
Shortlands (Bromley)
Biggin Hill (Bromley)
East Sheen (Richmond upon Thames)
Hacton (Havering)
Sanderstead (Croydon)
Emerson Park (Havering)
Bickley (Bromley)
Carshalton South and Clockhouse (Sutton)
Cheam (Sutton)
Cranham (Havering)
Teddington (Richmond upon Thames)
Eastcote and East Ruislip (Hillingdon)
Crook Log (Bexley)
Nonsuch (Sutton)
DISCUSSION ON DATA ANALYSIS
Understanding which areas pose a health risk can help practitioners make better decisions at a systemic level. Whether it is which areas need environmental pollutant reduction or which areas need more health support. Additionally, it can help GP’s identify which patients could be at a health risk due to environmental pollutants to better prepare their health programmes. Finally, citizens, can use this information to campaign for better urban planning strategies that affect their health.
Limitations
Despite adding another layer to the information provided by the SRS, the UHI displays the same general limitations as the SRS in that it is based on aggregate averages and is not a tool for referencing the exposure of specific individuals. It also shares the weight between environmental and psychosocial factors when displaying a score (meaning each is 50% of the total score) when that is not proven to reflect the real, much more complicated dynamics and influence of these factors that researchers and local authorities are still trying to comprehend. It may be the case that there’s a threshold for both to reach together, that they grow exponentially, or that a threshold of one amplifies the other. For simplicity, we have kept them equal.
CLIMATE CHANGE, INFRASTRUCTURE AND URBAN HEALTH
Climate change will exacerbate pollutants and likely create different ones, given how it is already wreaking havoc on poorly planned and tired infrastructure. There are many case studies to learn from, such as the New York City heatwave of 2019, which caused Con Edison to take pre-emptive measures to protect vital equipment due to the unprecedented usage brought on by the high temperatures.
This resulted in Con Edison turning off the power to a neighbourhood in southeast Brooklyn. The problem with the decision was it took power away in an area that scores a 4 out 5 in the Heat Vulnerability Index (HVI). The HVI is a metric developed by Columbia University to estimate the risk of heat-related deaths across different New York City neighbourhoods.
Con Edison’s pre-emptive action could have potentially put people’s health at risk as the neighbourhood where the outage took place was already vulnerable to the effects of heat.
While urban regeneration cannot make direct decisions about power grids, it can incorporate built environment interventions to bring the urban heat index down, such as planning for more green infrastructure, creating housing regulations that require homes to be built with heatwave considerations, reducing the amount of concrete, etc. The health risks associated with heat can range from instant death or lifelong injury due to heatstroke. The hyperthermic element of heatstroke can also bring long-lasting neurological damage, which can lead to memory and attention differences.
Heat is only one of the many pollutants that affect people living in cities; therefore, a key question is what happens when people are exposed to multiple pollutants and what effect this has on their biological systems? Furthermore, who are the demographics that are the most vulnerable due to levels of exposure? Understanding which areas are more vulnerable to health risks can help make more effective urban regeneration decisions related to urban health, especially as climate change puts new strains on urban infrastructure.
We also need to consider what biological inequality will look like in the face of climate change. For example, low SES communities already experience higher levels of UHI effect due to poor green infrastructure; when a heatwave occurs, they experience higher micro- environmental temperatures, which puts them at a higher risk for heatstroke effects. Finally, climate change can be a source of further stressors for those living in poverty. This can range from living in cold or hot homes due to poor insulation and inability to acquire resources due to income shortages, to living in environments with mould due to wetter winters and poor ventilation. Additionally, living with mould is not just a psychological stressor of living in a visibly dilapidated environment, it can also have an effect on mental health as it is linked to both anxiety and depression.
With this understanding, it is important for urban planning, development and management to include biological measures into their strategies, starting with insight from neuroscience.
RELATED WORK